.
This blog will contain a dozen charts with simple text. Charts are visual proof of what’s happening in the investing world.
.
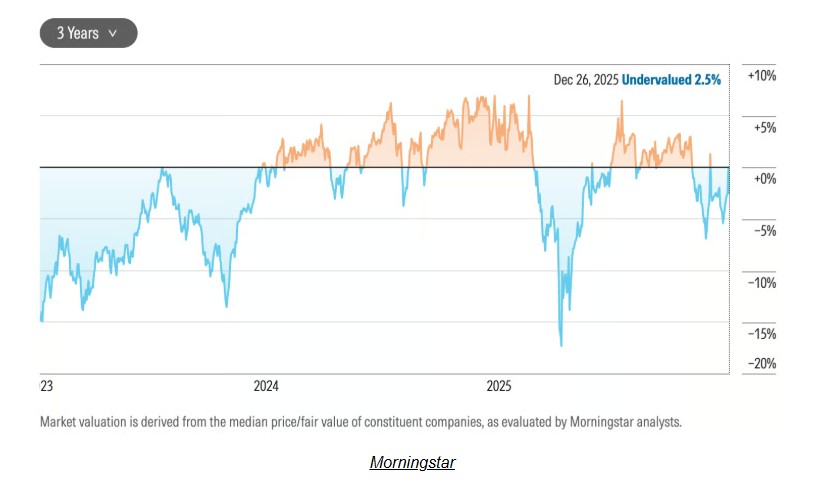
U.S stocks are currently UNDERVALUED… chart via Morningstar Analytics:
.
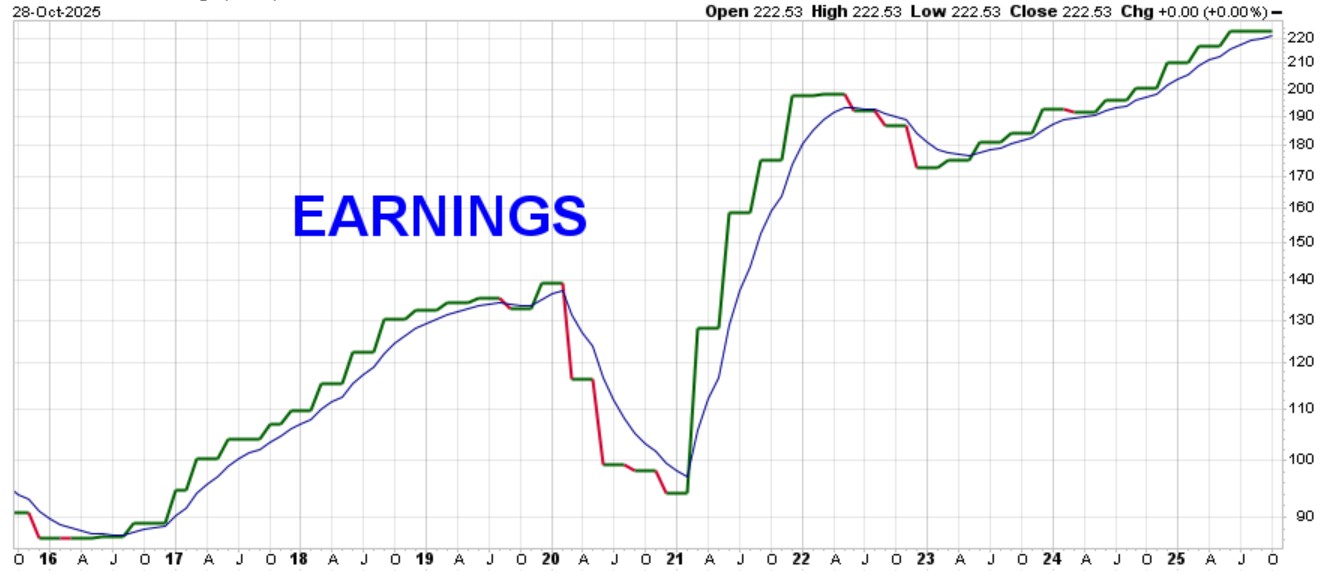
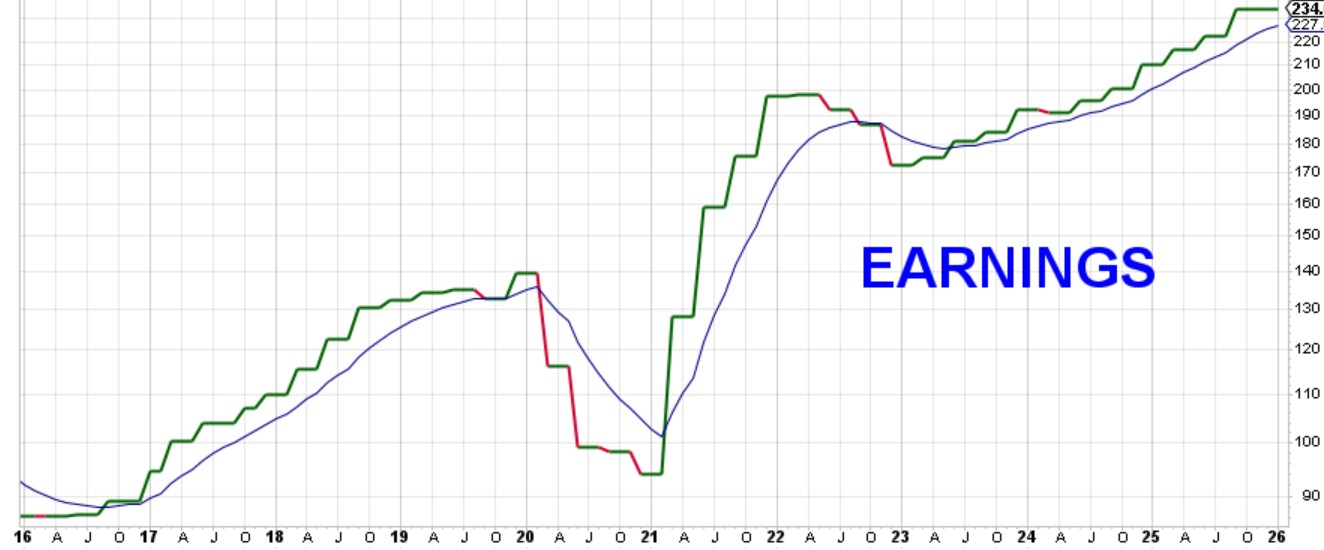
Stocks move higher primarily based on good corporate earnings. Earnings just keep marching higher. You can see how earnings dipped during 2020 Covid and during the 2022 bear market:
.
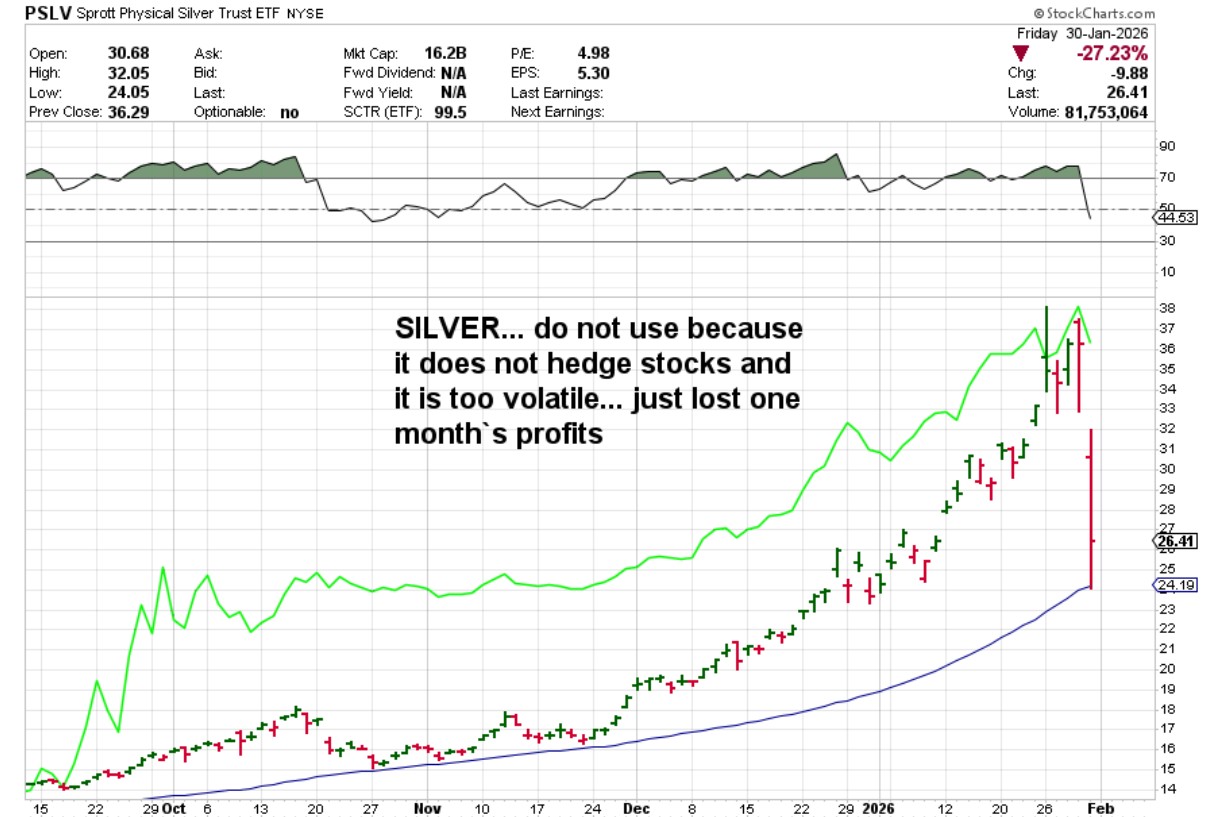
The market began a brief correction on Friday January 30th, concentrated in metal commodities and primarily in silver, because these assets had rapidly become parabolically overvalued over the past couple of weeks… metals will soon recover and move higher at a realistic rate (MarketCycle does NOT hold silver and you can see the note to myself written directly on my chart, and updated after the drop):
.
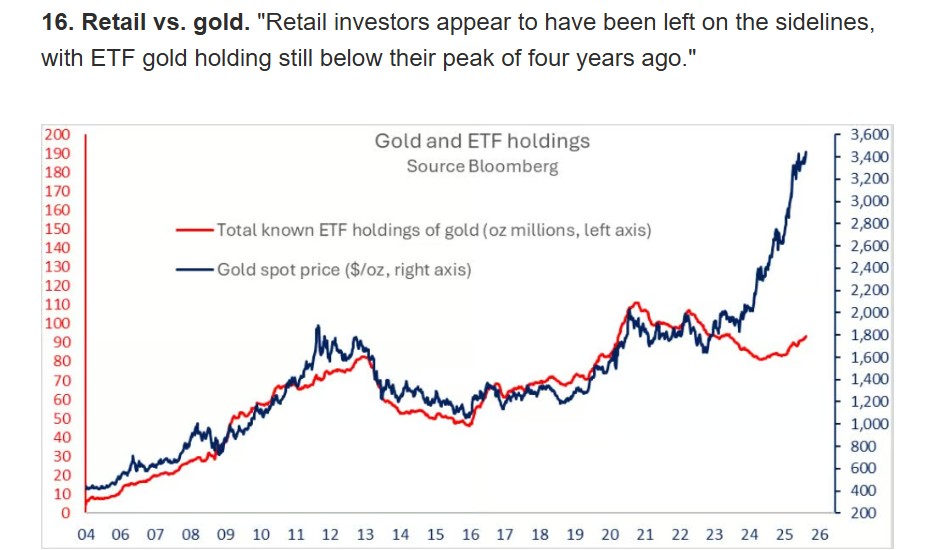
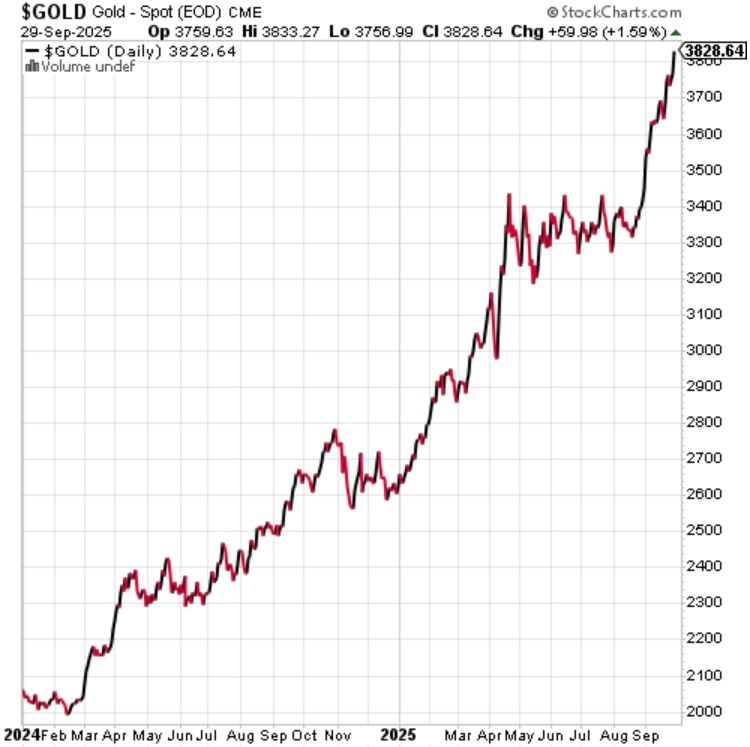
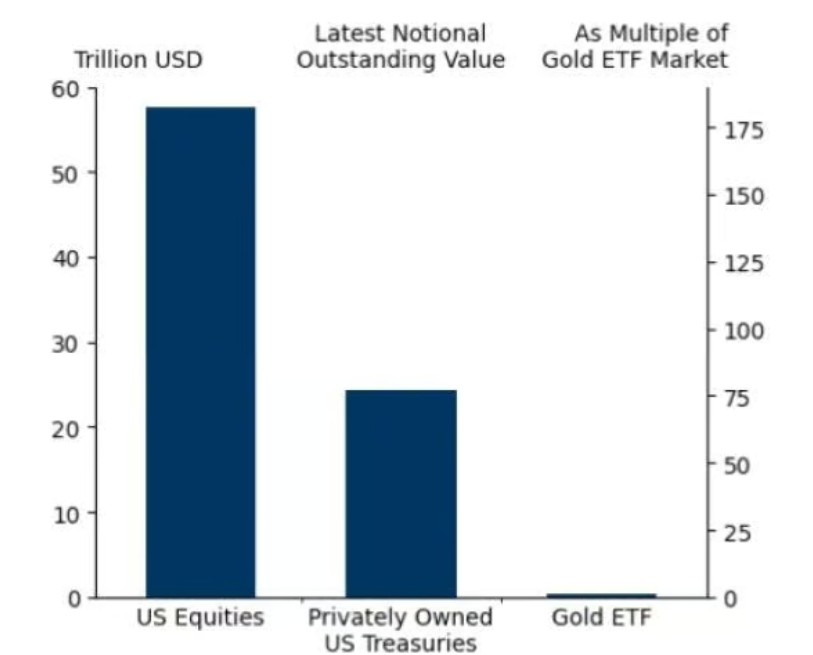
Despite the recent pullback, GOLD is not overbought and gold holdings are still tiny compared to the stock and bond holdings in most investment accounts (chart courtesy of Bank of America Research):
.
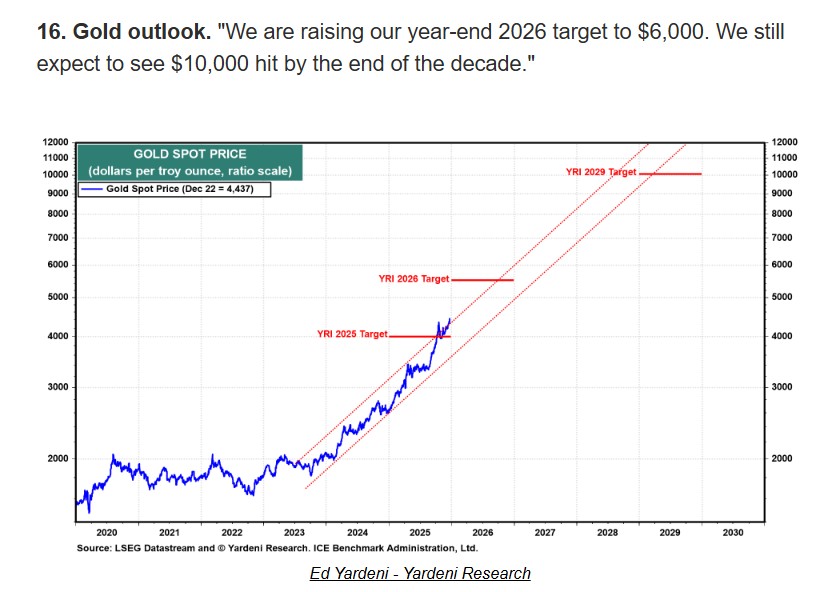
The future (trend channel) path of GOLD according to the highly respected Yardeni Research (to which I subscribe):
.
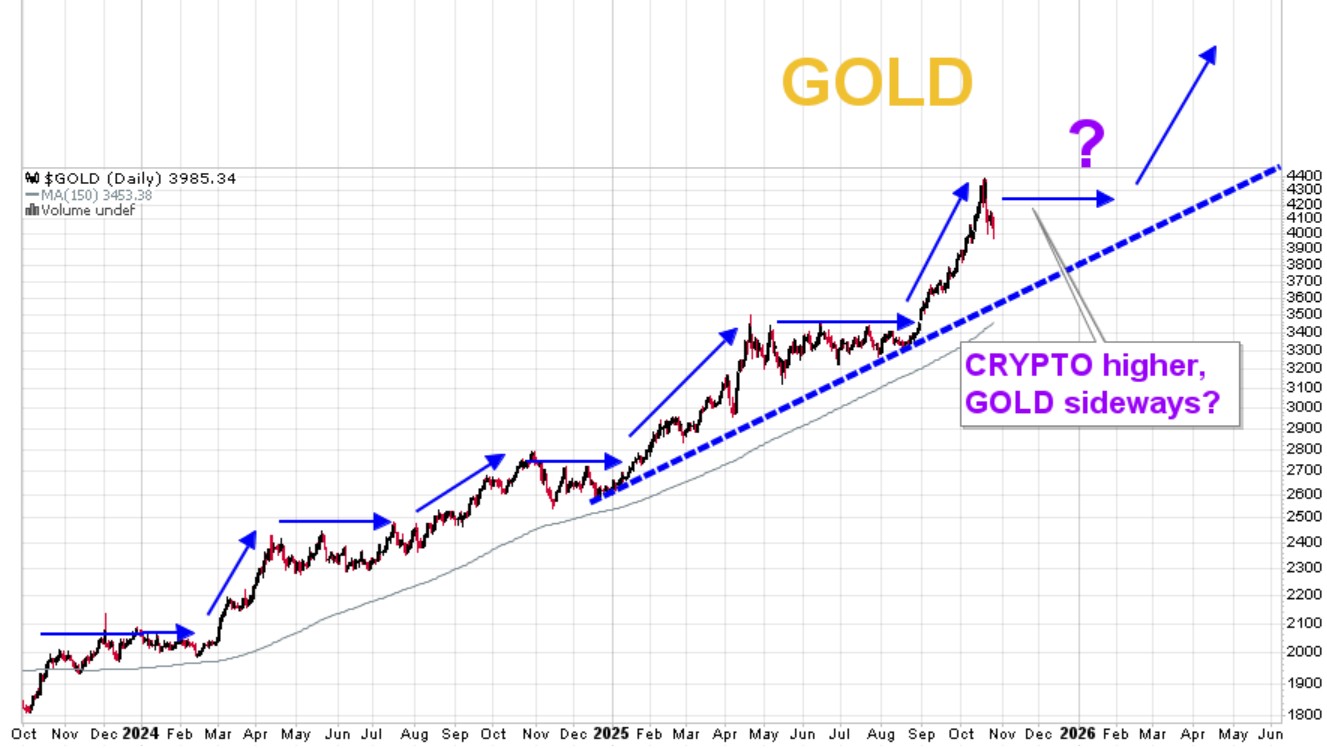
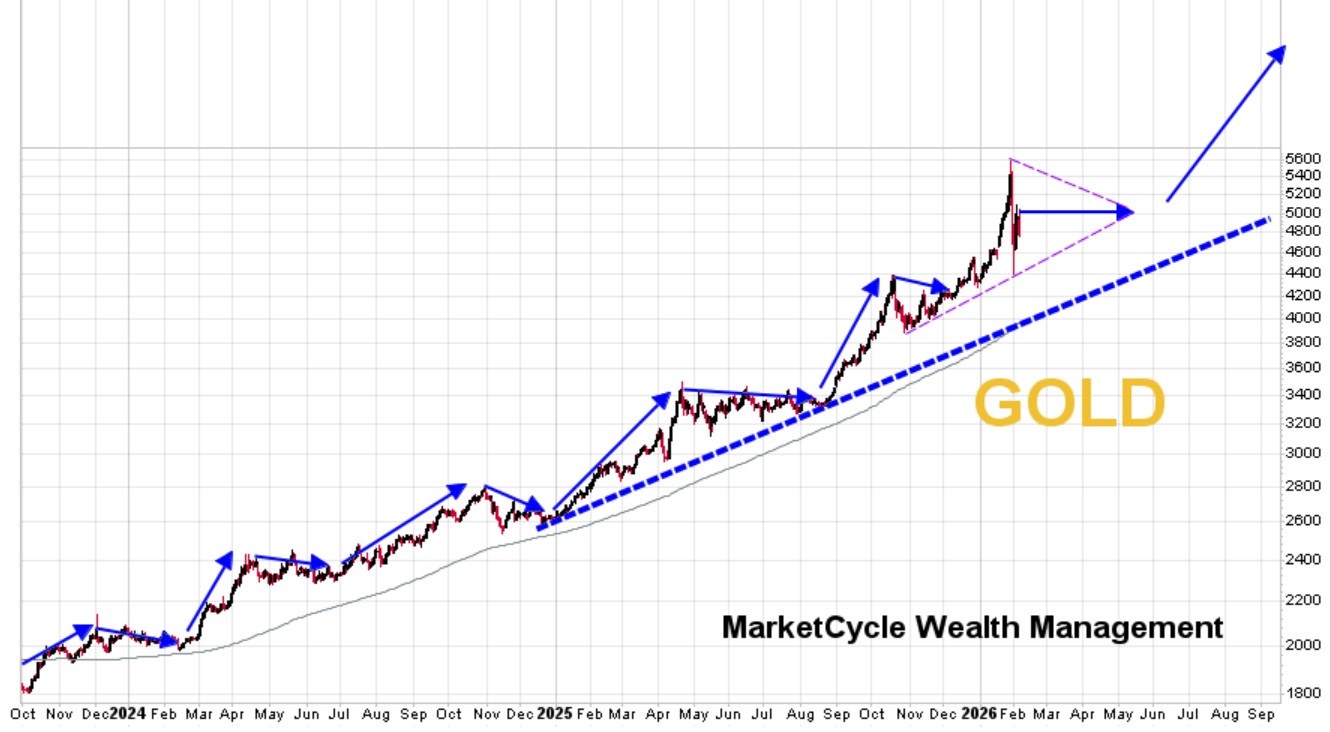
MarketCycle’s thesis on the possible movement of gold over the coming year:
.
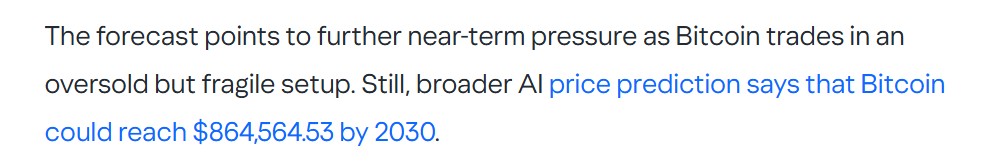
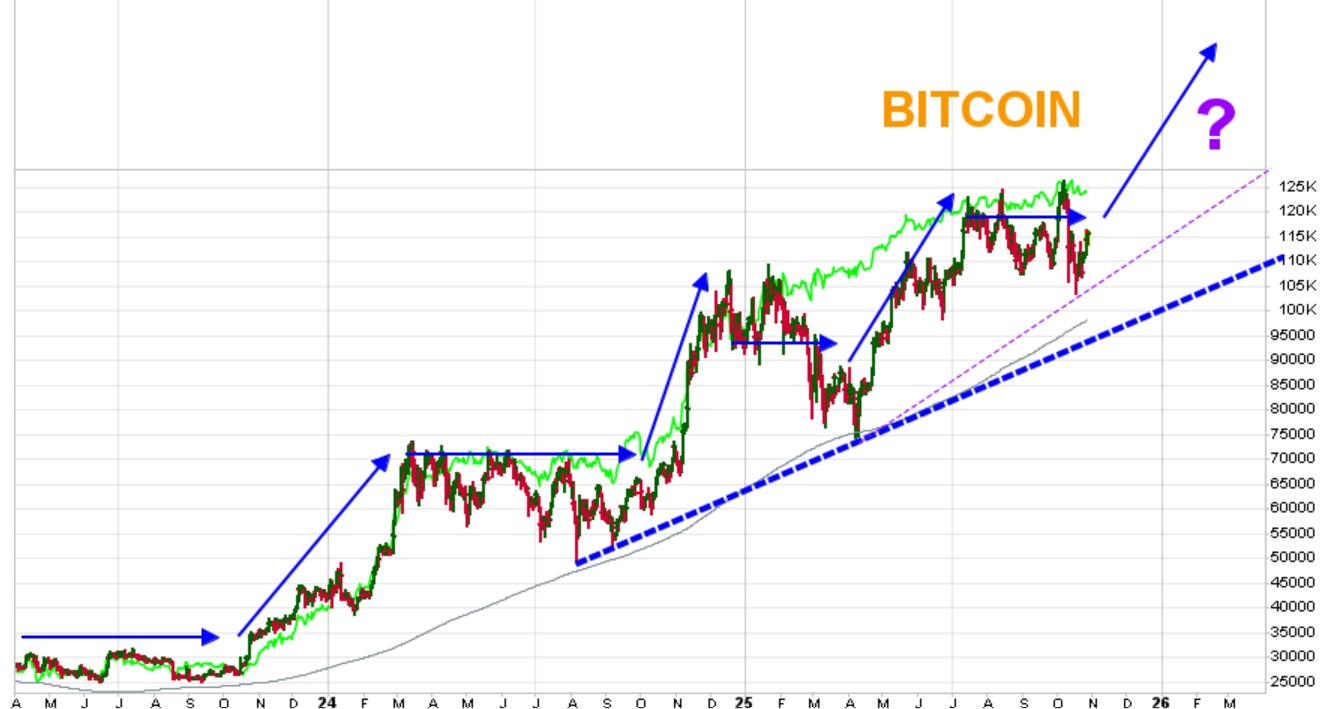
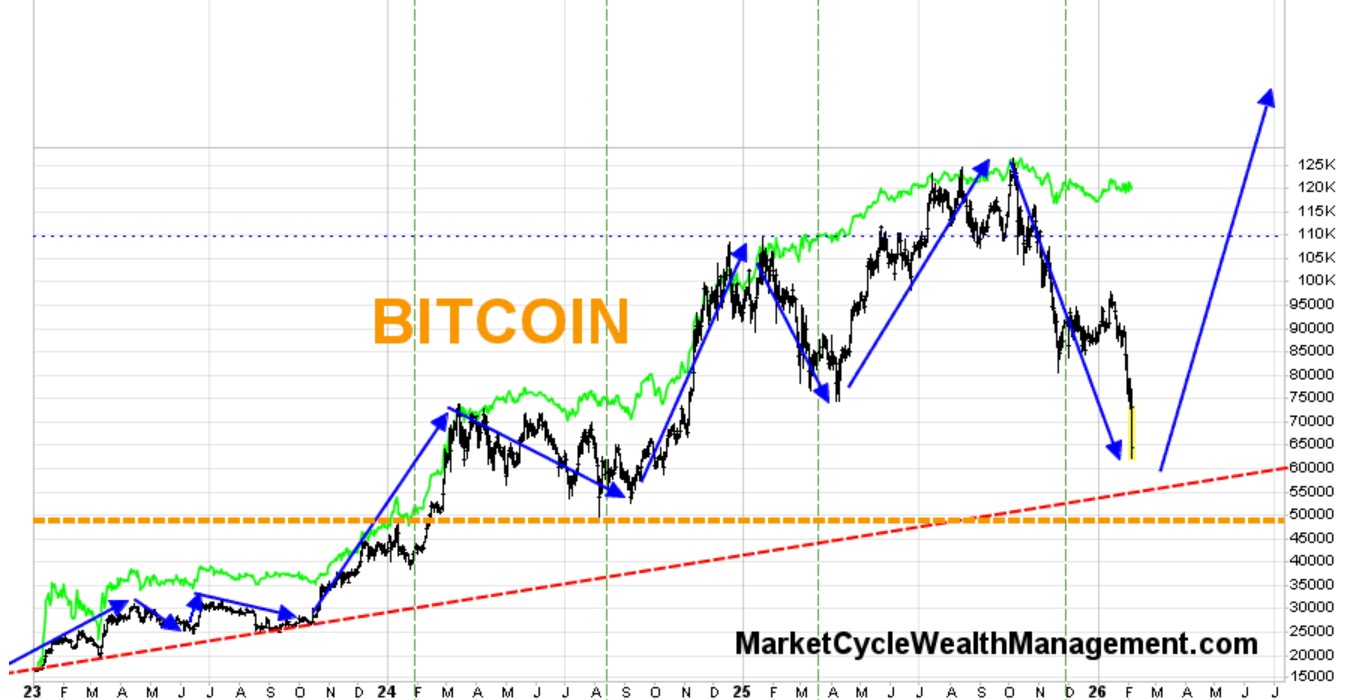
MarketCycle’s thesis on the possible movement of bitcoin over the coming 6 months… the straight down bar on the right side of the chart is a “margin call” and true to form, a 14% capitulation happened almost immediately, on the Thursday night futures market. If the market has not now yet bottomed, then it will likely be “sooner rather than later”… gold and bitcoin usually take turns leading higher:
.
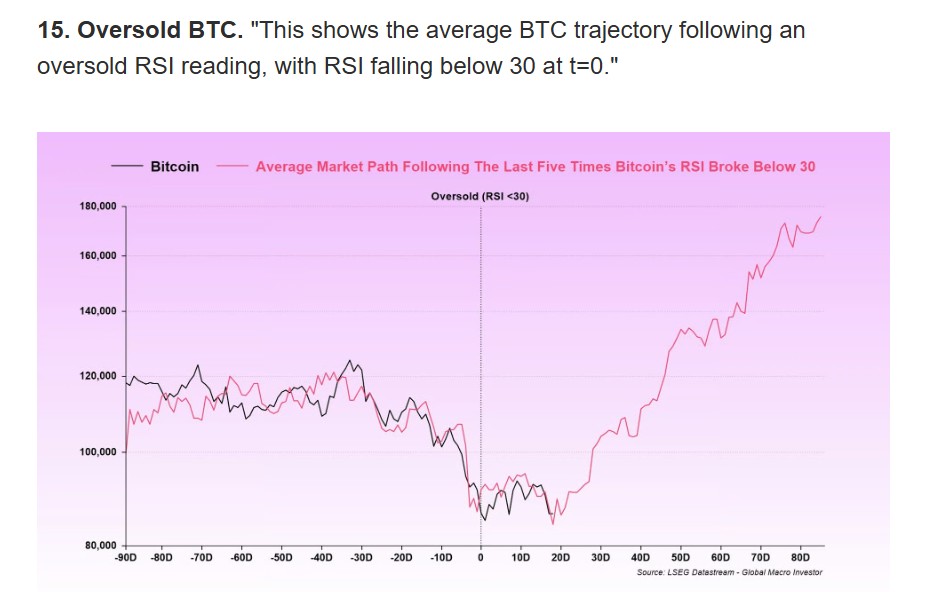
The normal path of bitcoin after it reaches oversold levels of below 30 on RSI, which it has now done, is shown below… Chart courtesy of Global Macro Investor via Daily Chartbook, to which I subscribe:
.
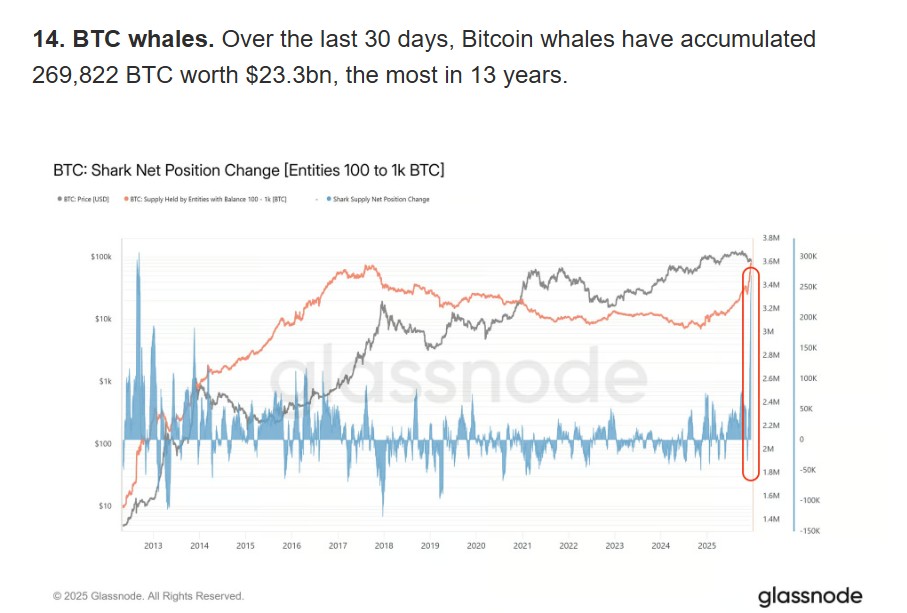
The really big crypto players are already starting to accumulate more:
.
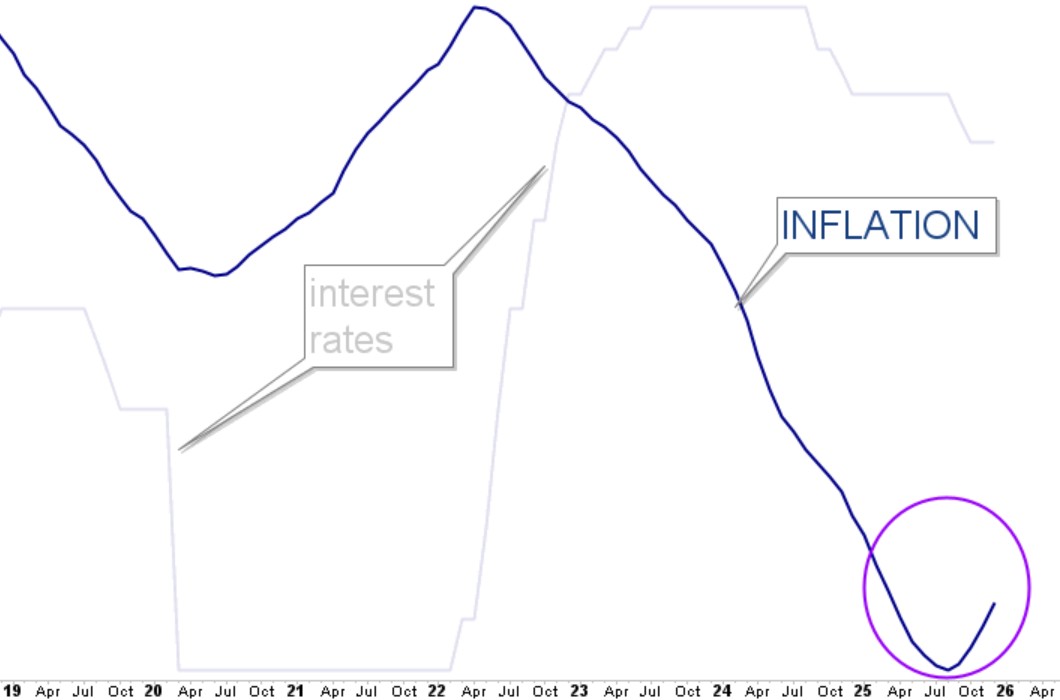
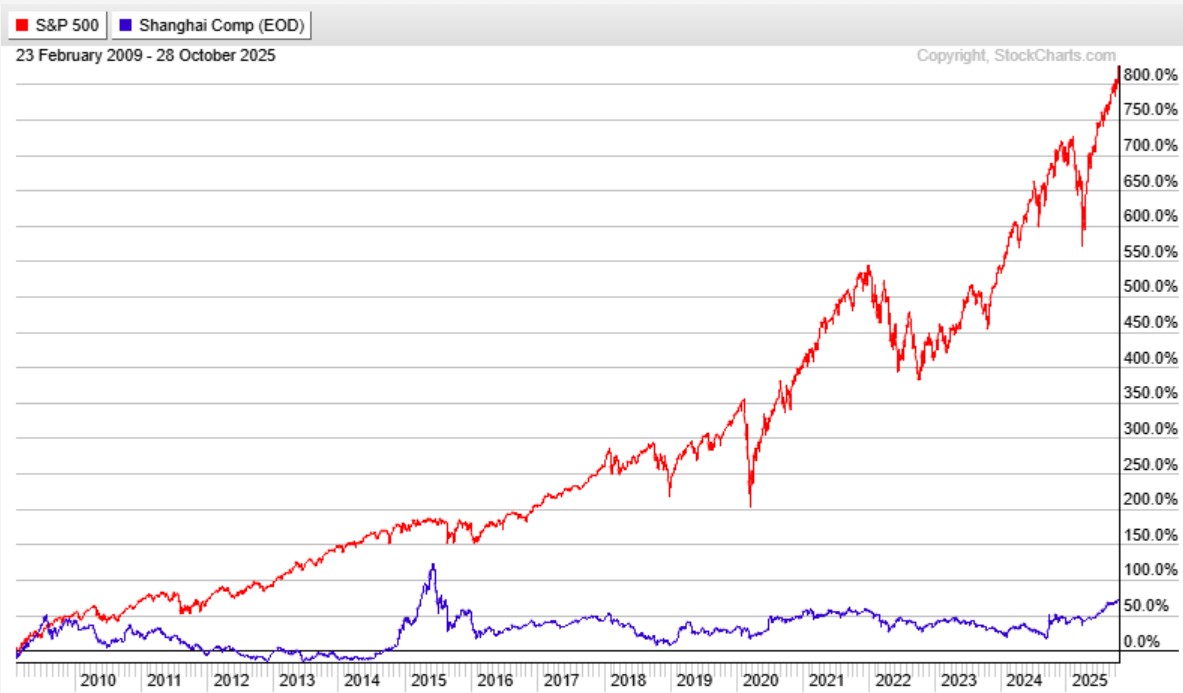
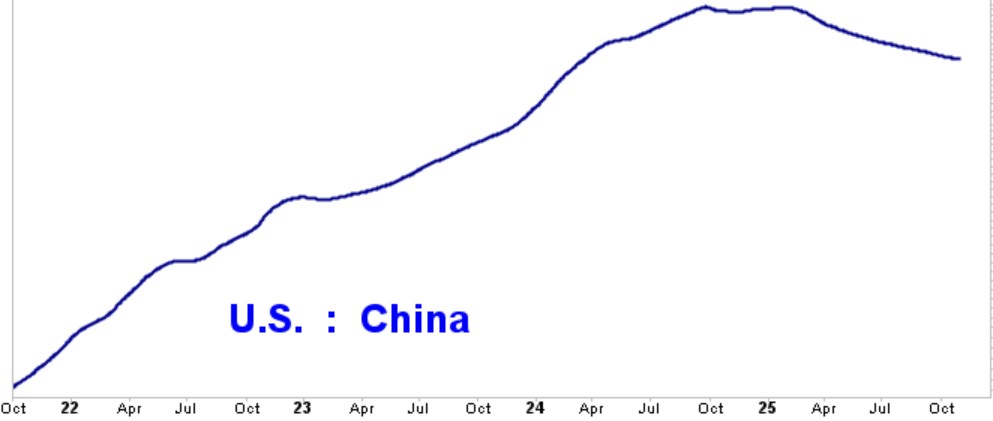
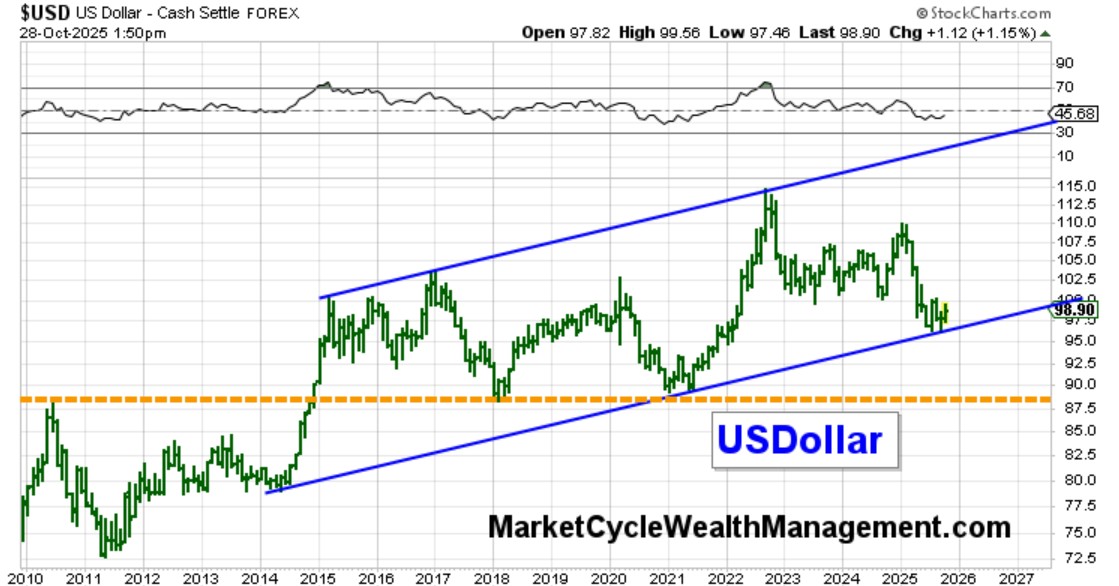
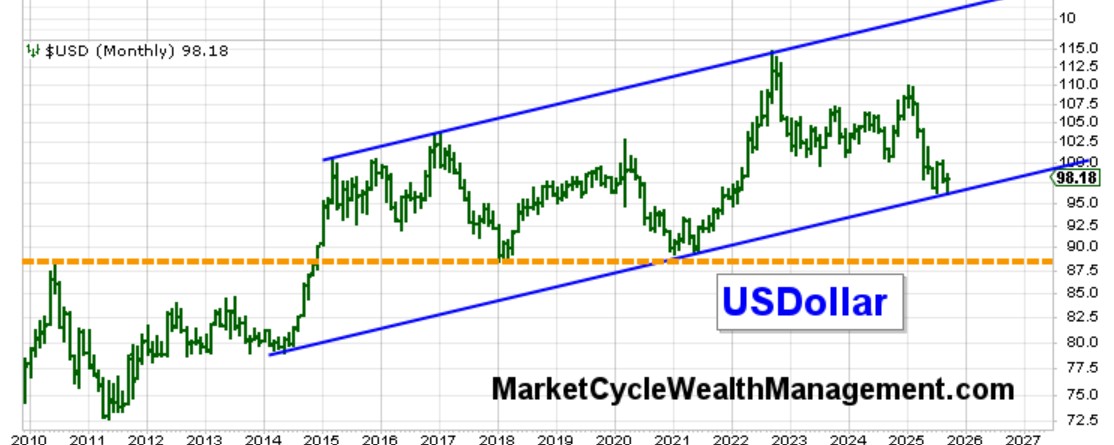
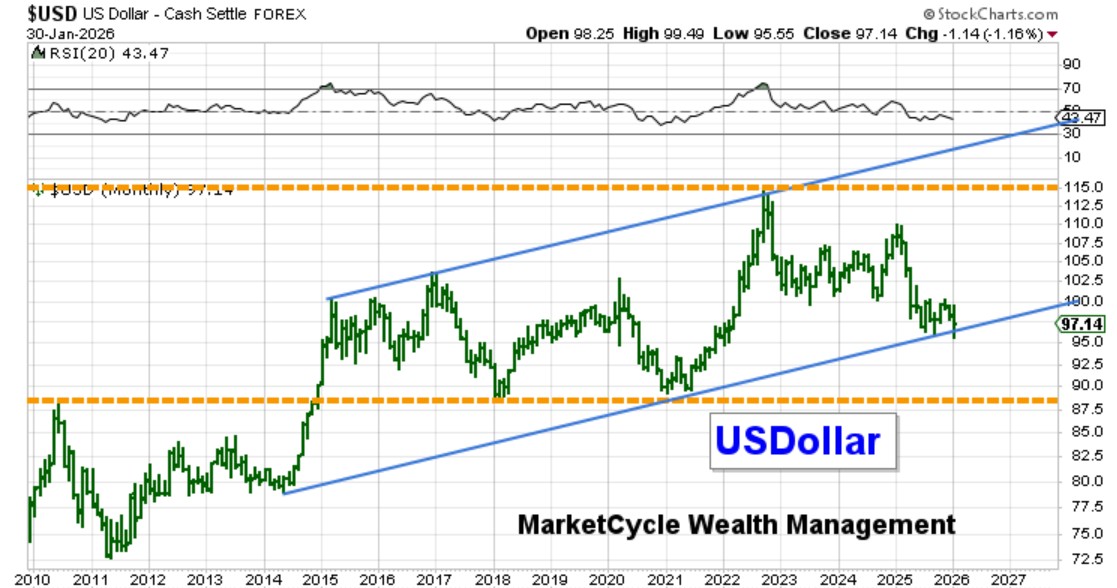
Gold and crypto have been moving higher as protection against weakening global currencies, it’s not just the USDollar that I worry about, although the USD has now broken below a 12-year support line (see far right green bar that is now below its blue bullish support line). Likely worst case scenario? I would expect the USDollar to very slowly gyrate up and down within the new dashed orange walls of the below sideways trend channel for the next few years. It is possible that the coming new Federal Reserve Chairman (Warsh) may be more hawkish than expected and this would help prop up the USDollar.
.
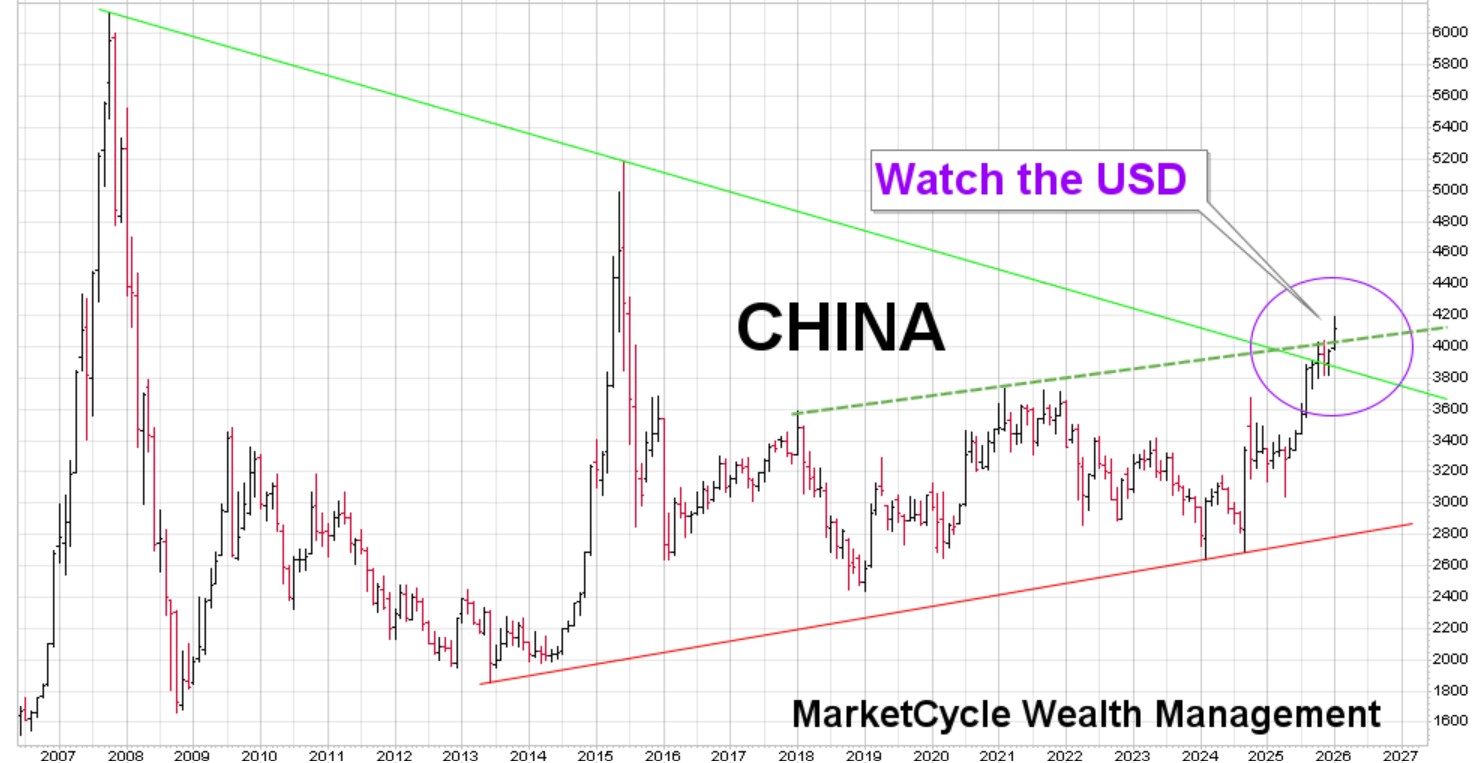
MarketCycle has moved part of our portfolio to protect against USDollar weakness… one of these holdings is China technology as China moves above both its 20-year and its 8-year overhead resistance lines at nearly the same time:
.
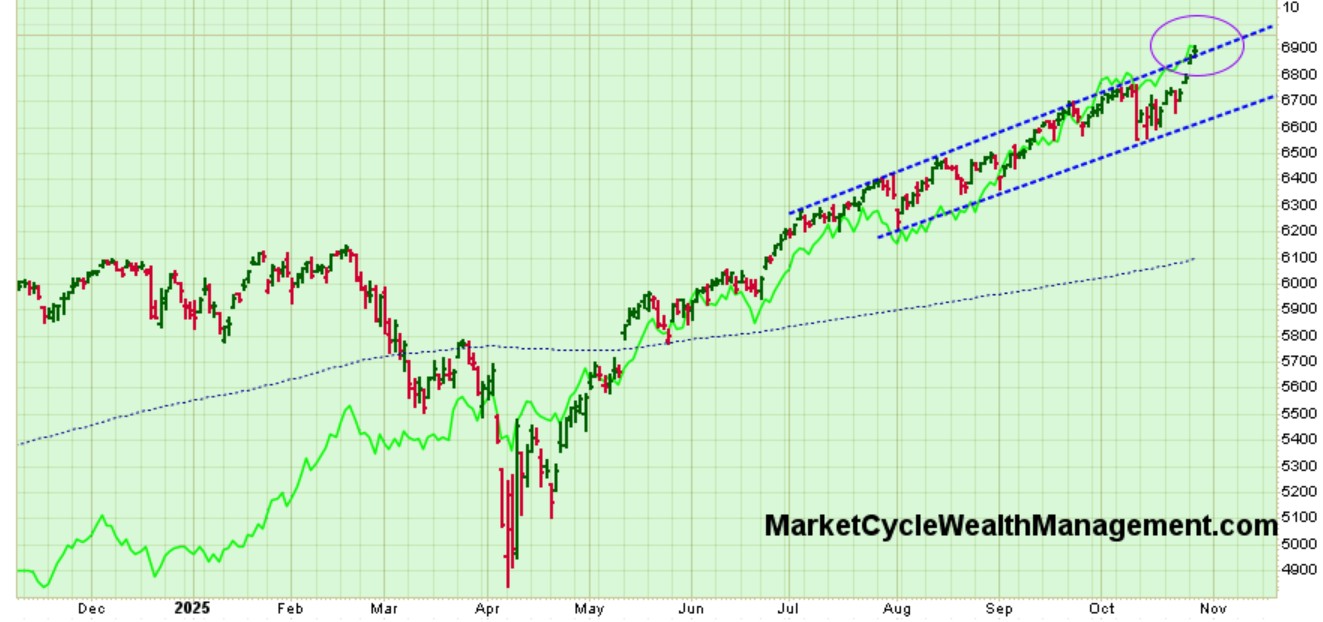
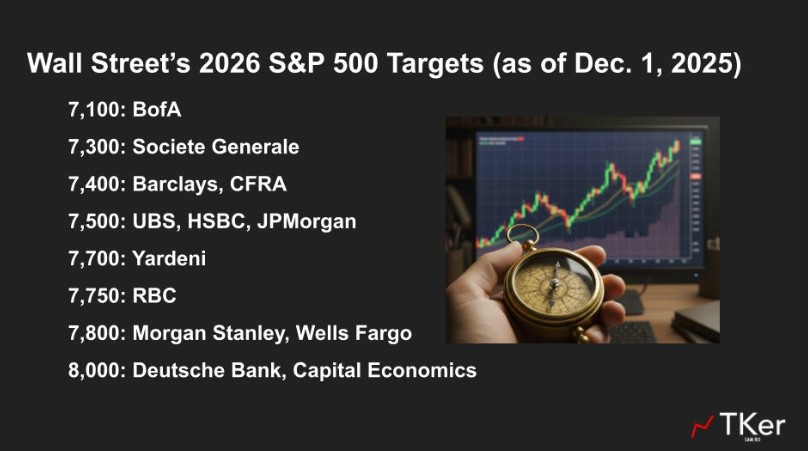
Some end-of-year-2026 projections… all up (Yardeni Research just raised to 8000, as did Tom Lee of Fundstrat… I subscribe to both services):
.
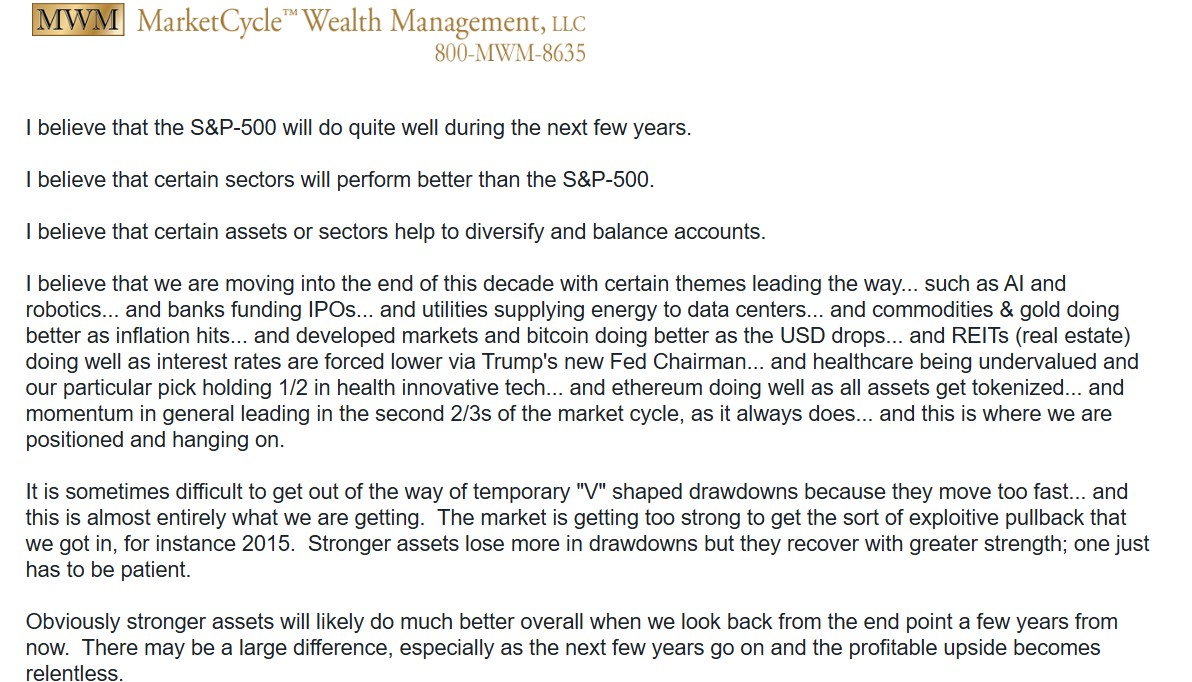
SUMMARY: STILL bullish on global stocks (despite news caused volatility) and bullish on quality corporate bonds, gold and metals, select sectors and themes. We are generally avoiding silver and Treasuries and a few select sectors. I expect at least one bigger bump in 2026, but for the year to end on a high.
.
Thanks for reading!
MarketCycle Wealth Management does one thing… we manage investment accounts and we try hard to earn our keep via using our decades of experience in the markets. We are affordable and it is simple to become part of our family.
.
.